Auto-Tune
In music production, Auto-Tune is an effect plug-in that can alter a pitchy, out-of-tune melody to the correct musical notes. This process consists of analyzing a melody from an audio signal, identifying the pitches of the melody and determining the closest musical notes that the melody should be, and altering the original signal to those notes. Our project explores this process by following these same steps, allowing us to apply our digital signal processing knowledge and better understand how Auto-Tune works.
PROCESS
01
Get and Filter Audio
Data
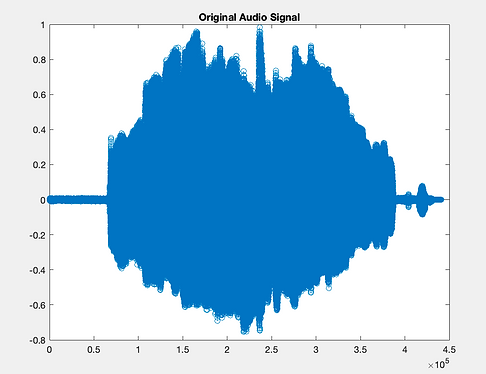
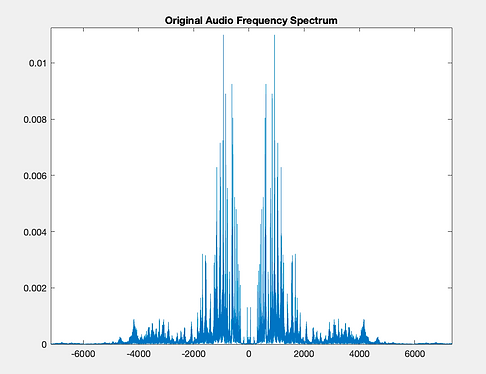
Our data consists of pre-recorded mono audio signals that are in .wav file format. The samples include vocals singing major scales, both with and without solfège, guitar, and vocals over guitar.
Filtering Techniques
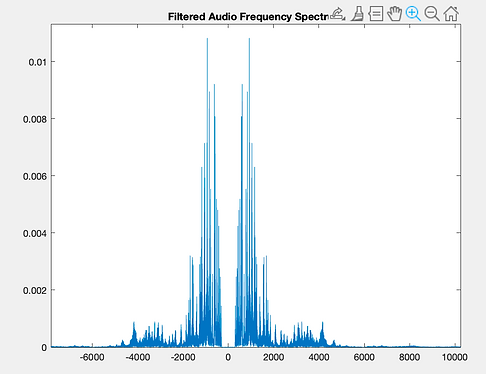
Our filtering process consists of a bandpass filter and a noise gate. Both of these steps eliminate harmonic information from noise, making it easier to detect the given audio signal's pitches in the next step.
The bandpass filter is a 7th-order Butterworth filter with a bandpass range of 300 Hz to 10 kHz. This bandpass filter maintains the given audio signal's timbre while cutting out unwanted muddy sub-frequencies and high-frequency mechanical and electrical noise.
The noise gate adapts to the given audio signal's dynamic range by detecting the largest dynamic leap and assuming that this is when the performer has begun singing or playing. The algorithm then attenuates anything under decibel level prior to this leap. The noise gate gets rid of unwanted background noise while the performer is not singing or playing.

02
Detect Pitch
Detection Algorithm
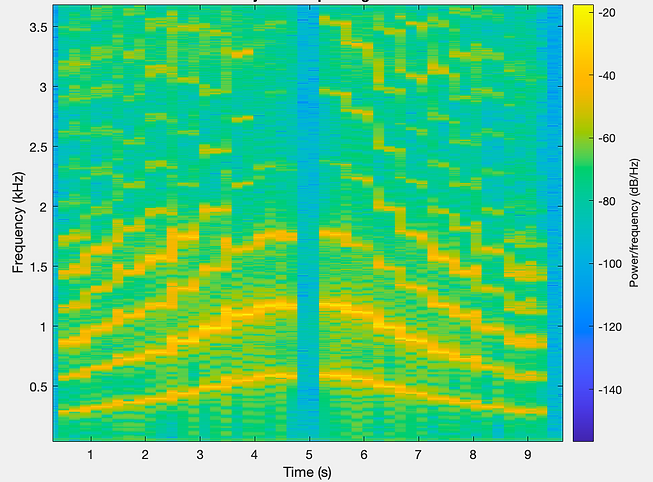
In order to detect the pitches of a given signal, we determine the fundamental frequencies of each pitch through spectrogram analysis. However, for detecting the fundamental frequencies in vocal samples, we must be mindful of the harmonics produced by the human voice. Certain vowels have more energy in the harmonics than in the fundamental note. In the following image of a scale being sung, notice that there is more energy in the second harmonic for most of the notes.
In order to properly shift the sample, we need to find the fundamental pitch. For this, we use the Harmonic Product Spectrum. This technique splits the windows in the spectrogram in segments and multiplies them sample by sample so that the fundamentals grow larger when multiplied by their harmonics. We implement this by multiplying each window in the frequency domain by downsampled versions of itself. The following image demonstrates this technique.

Planner Function
In order to get an optimal spectrogram for analysis, parameters like the window and overlap must be carefully chosen. Signals that have a lot of change in a short period of time will require smaller windows to properly capture the fundamental pitches. Likewise, the overlap between each window should also be chosen in accordance with how the signal changes in short periods of time. To automate the process of deciding these parameters, we created a planner function that looks at the transients in a signal and decides the proper window length and overlapping. All windows are rectangular windows, as this has proved to be the most effective window for this application.
Quantizing the Pitches
Once all the fundamental frequencies are identified in all the windows, the program must then find the closest corresponding musical notes for each fundamental frequency in order to properly shift the given signal. To find what the closest note is, we must quantize the fundamental frequencies to a grid of known notes from Western music theory. This grid is based on A4 being equal to 440 Hz. Knowing that a one octave difference corresponds to doubling the frequency, a good approximation is to set the twelfth root of two as the factor that, when multiplied by a frequency, yields one semitone above it. With this knowledge, the following formula is derived:
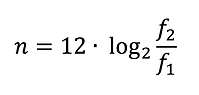
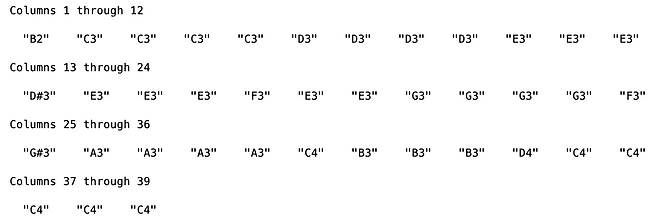
Here, n is the number of semitones f 2 is from f 1. Taking f 1 to be 440 Hz, the formula will output how many semitones from A4 that f 2 is. If n is negative, f 2 has a lower frequency than f 1. In most instances, n is not an integer. So, we round n up to the nearest integer to reveal how many semitones the nearest note of the detected frequency is to A4. Then, n is added with the index of A4 from the notes array, and the new index is the quantized pitch that the given signal will be shifted to. Here is an example of the melody output from a given signal.
03
Shift Pitch
Pitch Synchronous Overlap-Add
Audio signals are comprised of repeating patterns within pitch periods, which determine attributes like tone and vowel identity. To actually alter the given audio signal after determining the correct notes without distorting these important attributes, we use an algorithm called Pitch Synchronous Overlap-Add (PSOLA). The PSOLA algorithm involves “stretching” or “squashing” a signal in time to change its frequency. Once the correct notes of our audio signal are identified, the PSOLA algorithm allows us to tune the given signal without distorting the characteristics that influence if and how words are understood by a listener.
Identifying the Pitch Period
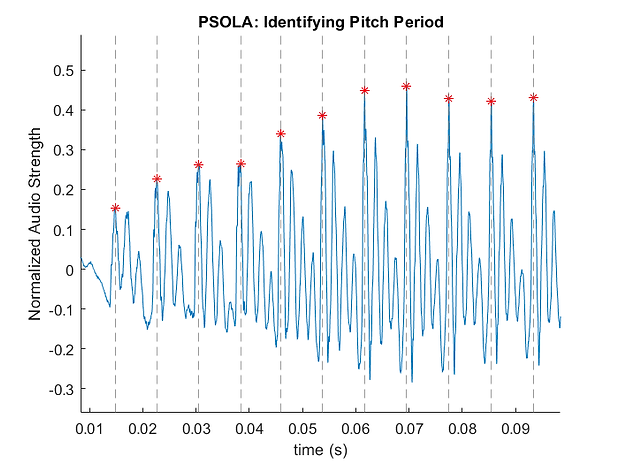
As mentioned above, each audio signal can be split into repeating patterns, the distance between which is defined as the pitch period. This is commonly calculated as the distance between the local maximum value of each pitch period. To calculate this in MATLAB, we windowed our audio sample with the fundamental frequency found in our pitch detection algorithm (window length = 1/pitch). Then, we determined the maximum peak within each window and calculated the pitch periods as the time between peaks. The following image showcases these repeating patterns of an audio signal, the time between maximum values in a pitch period.
Extracting the Pitch Period
To extract each pitch period, a Hamming window spanning two pitch periods is applied at every previously identified pitch period peak. Pitch periods are stored separately as rows in a matrix for processing.

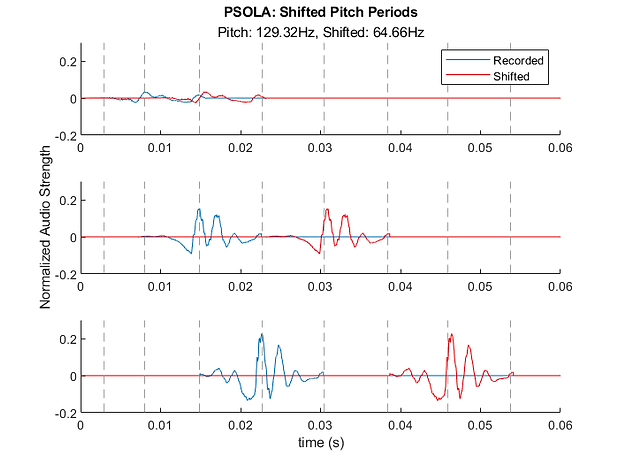
Shifting the Pitch Period
For simpler PSOLA implementation, we assume the audio signal is a singular note with a given pitch. With the pitch periods identified and extracted, the new pitch period is calculated as the measured pitch period times the ratio of the measured and ideal pitches. Each extracted pitch period is shifted to match the new pitch period. The extracted pitch periods are padded with zeros to prevent any data from being lost. The shifted pitch periods are then summed to form the new, tuned audio signal.
Note that each shifted audio signal must be resized to match the length of the given audio signal to avoid distortion. If the shifted signal is smaller (i.e., an increase in pitch), groupings of 15 pitch periods are duplicated at the beginning and end of the signal until its size matches the original signal.
DEMO
Original Samples
Auto-Tuned Samples
(Samples labeled with "Multiplier" indicate that the pitch was multiplied by that value before Auto-Tuning)
ANALYSIS
This project was extremely beneficial to our use and development of our digital signal processing knowledge. Because we are all interested in music and audio, we were excited to further explore how audio can be altered with digital signal processing. Within this context, we were able to better understand how to implement skills such as filtering, windowing, and spectrogram analysis, while also teaching ourselves new digital signal processing tools. By choosing a specific music production effect to mimic, we were able to comprehend how algorithms like filtering and tuning might actually be implemented in the industry.
In terms of improving our Auto-Tune, finer resolution of the tuning process may be able to mitigate the audible fluttering that is heard in the affected samples. We could also further enhance this project by programming the processing of live audio signals and by creating a graphical user interface that a user could interact with.
Overall, we are happy with the results of our project, as we were able to successfully implement a working Auto-Tune algorithm.
DSP TOOLS
1
Spectrogram/STFT
In Class
The Short-Time Fourier Transform (STFT) is the basis for the spectrogram, which we used primarily for pitch identification. The result of the STFT was processed using the Harmonic Product Spectrum formula to find the fundamental frequency of each sample of an audio signal.
2
Windowing
In Class
During pitch detection, Hamming windows were applied in the time-domain to split up the signal into chunks for frequency-domain analysis. Additionally, while tuning with the PSOLA algorithm, Hamming windows are applied to split the signal into its individual pitch periods for shifting.
3
Filtering
In Class
For noisy input signals, a bandpass filter isolating the frequency range of human vocals was applied.
4
Pitch Synchronous Overlap-Add
Outside Class
The PSOLA algorithm involves “stretching” or “squashing” a signal in time to change its frequency. The signal is decomposed into unique repeating vocal patterns, called pitch periods, which are shifted in time to change their frequency. The PSOLA algorithm allowed us to tune the signal without distorting other important characteristics, such as vowel identity, that influence if and how words are understood by a listener.
5
Harmonic Product Spectrum
Outside Class
HPS is a frequency-domain formula used to identify fundamental frequency in an audio signal with many harmonics. Due to internal vibrations of vocal folds, the highest magnitude frequency is often not the fundamental frequency of an audio signal. HPS involves the multiplication of all harmonics in the frequency domain; the resulting highest-power peak is the true pitch of the audio signal.